Microsoft’s all-inclusive Business Intelligence (BI) Suite has a lot to offer. Expanding the power of SQL Server along with SSAS, SSIS, and SSRS, Microsoft is known to be the most dominant player with regards to BI platforms for enterprises.
Under its roof, falls Power BI Development – a cloud business analytics service that provides better analysis and visualization of information with improved efficiency, exemplary interpretation, and enhanced speed. Adding more to its potential, Power BI now offers a creative feature called Paginated Reports.
In this article, we will be going through everything that you need to know about Paginated Reports in Power BI.
Here is a gist of what we will be covering:
- Power BI – Introducing Paginated Reports
- Essential Attributes of Paginated Reports
- When You Should Leverage Paginated Reports?
- Essential Components Required to Use Paginated Reports
- How to Leverage Paginated Reports?
- Paginated Reports – Admin Setting
- Restriction of Using Paginated Reports
Power BI – Introducing Paginated Reports
SSRS (SQL Server Reporting Services) is a powerful tool leveraged to paginate reports along with perfect formatting and precise fitting.
Paginated Reports have been termed as ‘Transactional Reports’ or ‘Many-Paged Reports’, and are developed on the basis of RDL (Report Definition Language) in SSRS. These are also called ‘Pixel Perfect’ because you can easily control and manage the layout of every report page.
Power BI’s paginated report builder is an authoritative tool that helps you prepare all the reports.
After the entire report is created for a particular data that you would like to display, the processor combines your report with a specific layout to provide you with the desired end result. Later, you can preview the report in the builder and then publish it on Power BI platforms or leverage it with Power BI Mobile.
With Paginated Reports, you can gather information from multiple sources through technologies such as SQL Server, Teradata, Power BI Premium, Azure, etc.
But, in order to use these reports through Power BI, it’s important to have access to all the Power BI Premium Datasets. This is because Paginated Reports don’t work with other Power BI versions. However, Power BI’s Embedded version helps developers integrate their Paginated Reports with their apps.
Essential Attributes of Paginated Reports
- It can print the complete data irrespective of its length.
- It enables you to control the layout of every report page.
- It can be either shared as PDF through emails or easily printed for multiple users.
- It can be examined in the PDF format along with big datasets and multiple pages.
- It supports different formats such as PDF, Microsoft PowerPoint, CSV, Microsoft Excel, XML, and Microsoft Word.
- Its visualization is easy to improve with images and other innovative features.
When You Should Leverage Paginated Reports
Paginated Reports are the perfect solution, especially when you have to display information on several pages, as soft or hard copies, to individuals or organizations. These reports hold great importance when massive datasets are involved and information and other statistics have to be displayed on large tables.
You can leverage Paginated Reports while using the filtering feature of the drill-down method.
This report is compatible with prefixed formats like headers and footers. A great example of using Paginated Reports will be for the P&L (Profit and Loss) Statement.
Essential Components Required to Use Paginated Reports
- Power BI’s premium version is a must-have
- Install the Paginated Report Builder offered by Power BI
- Different workspace for the reports
- Supported technologies like MS SQL, Server Analysis, Oracle, Azure SQL, Teradata, Microsoft SQL, and Azure Analysis Services
How to Leverage Paginated Reports
- Get Paginated Report Builder installed on the system.
- Open the builder and create datasets by gathering information from multiple resources for analysis and computation.
- Choose the layout format that you want the report to be prepared in – chart, free form, or matrix.
- Build the layout in a comprehensive and precise manner because it’s going to be the final feel and look of your report.
- Use multiple parameters and functions, but only those that can be combined with various datasets.
- Leverage conditions and filters as per the users’ requirements.
- Use the drill up and drill down functions to garner in-depth insights and details regarding the data.
- Add interactive data visualization features to your reports to make them comprehensible and superior.
- Add gauges, indicators, charts, and sparklines to display summarized information.
- After the format is created, you can publish the report in any of your workplaces and also offer it to other users.
Paginated Reports – Admin Setting
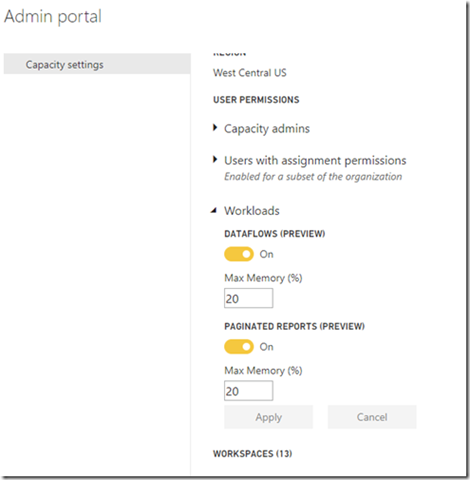
In order to leverage Paginated Reports on the premium version of Power BI, head to the ‘capacity settings’ in the admin portal and enable the reports workload. Don’t forget to set the memory capacity you’d want to contribute.
By default, nearly 20% of the total memory is dedicated to the report but you can choose to contribute around 50% of the memory.

Source: Microsoft.com
Paginated Report – Default Memory Setting
When using Paginated Reports purchased via Power BI, you will require the premium servers P1, P2, and P3. However, if it’s similar to Azure, then you will need the A4, A5, and A6 servers of Azure.
Restriction of Using Paginated Reports
- Only premium users can use Paginated Reports, not everyone can get access to it.
- It doesn’t work with certain sources, therefore gathering information from them could be a little difficult.
- Since the data gets drilled up, you cannot view Paginated Reports in the print format nor can the users.
- It doesn’t support innovative features such as document maps.
- It has shared datasets and data sources.
Leverage the Potential of Paginated Reports
Microsoft’s Power BI services provide you with the perfect platform for data visualization and analysis through interactive and desirable reports. It also keeps encouraging organizations to improve their sales efficiency and identify various perceptions.
By adding more to its potential, Paginated Reports have begun pleasing the existing users by offering interactive features while also attracting new users to experience its abilities.
Conclusion
Business Intelligence (BI) is currently on an elevated level – thanks to Microsoft for offering its support to this amazing Power BI technology along with an incredible feature of Paginated Reports.
As a business, if you’re finding it difficult to understand Power BI and its Paginated Reports feature, then feel free to seek the assistance of a Power BI Consulting firm today!
Related Articles
-
Excel v/s Power BI- Time To Switch Your Reporting Practices
Modern businesses know the significance of data analysis and are trying to make the most of it. Research states that firms generate about 44 trillion GB data annually. With such
-
How to Drive Success Leveraging Odoo ERP, Business Intelligence, and Data Analytics
Data analysis has become central to determining the best decision-making. But today, companies need an automated system to organize data at scale. ERP and BI are integrated and can be
-
Benefits of Power BI: How Different Can Industries Use Power BI in 2023?
Currently, the market value of Power BI is about 4.48% with almost close to 10,000 companies already using it. Technologies such as the Internet of Things, Artificial Intelligence, and others


