About Project
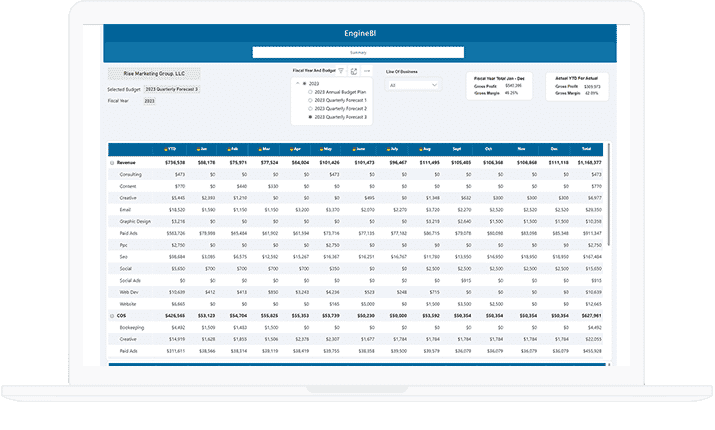
North American SaaS-based product company that offers businesses and institutions of all sizes a platform to view and manage their financial data. It gives the client’s customers more time and flexibility to focus on business growth. They wanted the team to create reports such as gross margin, gross profit, cost of service, and KPI combination in charts and graphs.
Web
Platform/OSFinance
Category
Brief
Brainvire’s Microsoft development team began with understanding the data thoroughly. To distinguish between YTD, Total, Actual, and forecast values in a single column, they created a calculated column in a power query. The team developed a calculated column to find out the locked months, calculated the respective amounts for that month as ‘Actual Value,’ and marked the remaining months as ‘Forecasted value.
Highlights
Brainers ensure a thorough understanding of the client’s requirements before starting development. They created a single row header for YTD, Actuals, Forecast, and Total Values and simplified decision-making by replacing Zero/Null values with ‘0.01’ in red color and restricting it up to four decimal places. Team Brainvire ensures to provide their clients with the best solutions at minimum costs to enable the clients to maximize ROI.
Case StudyFeatures
Gross Profit Reports:
Gross Profit and Margin reports for various customers helped make smart data-driven decisions.
Role-Based Reports:
Managing role-based reports using embedded URLs and customer slicer gave a view of consolidated reports for all customers.
Interactive Dashboard:
Created an interactive dashboard to integrate with the existing application for displaying the reports.
Actuals Based Re-forecasting:
Re-forecasting based on the actual simplified comparison, enabling adjusting the plan and with one’s accountability.
Tech Stack
Power BI
MySQL
Azure DevOps
SQL SERVER
