About Project
The BI (Business Intelligence) reporting platform is a unique digital initiative of Brainvire and a serial entrepreneur from the USA. It can be used by businesses belonging to any industry and helps users get real-time insights with a few clicks.
Web
Platform/OSMEAN Stack, SAAS Based Platforms
Category
Brief
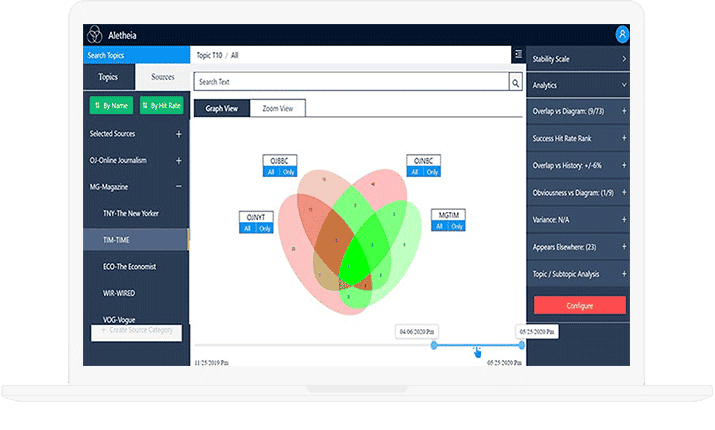
Aletheia is a data-driven & time-series application, wherein the collected data is represented in a circular and oval Venn diagrams and is very interactive. The graph resizing and change of colors happen in real-time depending on the density of data. Users can also zoom in from graph mode to data segment and pay careful attention to all the details. This helps the end-users make profitable decisions quickly.
Highlights
The reporting tool combines the latest capabilities of data science and business intelligence. Industries can use this solution to dig deeper into their business data and get valuable insights. They can drill down and drill up the reports to get what type of data they want. The colorful graphs and Venn diagrams make data analysis extremely easy for one and all. In a nutshell, it’s a game-changer for all industries.
Case StudyFeatures
Visualize massive volumes of data in the form of text, images, videos, embedded graphs.
Resizable and colorful oval Venn diagrams.
Adjust the time bar for a better overview of data.
Timely order fulfillment through 3PL service providers.
Faster search due to the in-built Elastic Search engine.
Zoom in from graph mode to data segment mode.
Tech Stack
MongoDB
NodeJS
Socket.IO
elasticsearch
ReactJs
