About
With around 100 faculty members and 3000 students, our client is a leading law school in the United States. This competitive law school in the United States is widely known for creating graduates who pass the most difficult California Bar tests. This school has been committed to high standards of research, scholarship, thinking, and living as a means of preparing students to engage the world and respond honestly and earnestly to those in a pluralistic society. Their goal is to achieve academic integration of law, human rights, and the first-timers of the Christian faith.
Project Highlights
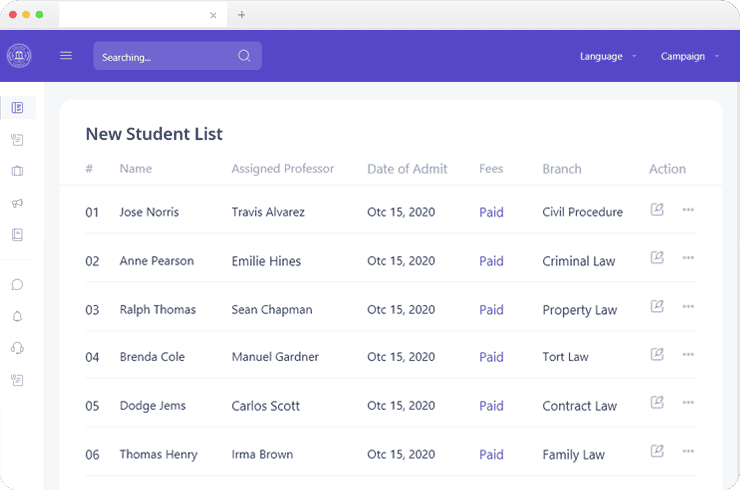
The client already had a database in place, but no database dictionary or reference document was present. Since they were previously using an MS-Access database, migrating to MS-SQL was a monumental task requiring careful examination of object relationships and avoiding redundancies. The task at hand was to comprehend and generate data according to reporting and analytical needs. The successful implementation of Brainvire's BI Reporting Solution aided the law school in making key decisions and making administrative functions more efficient.
Once the database dictionary was created, Brainvire's BI Reporting Solution was implemented. This solution included creating a data warehouse to store all of the data from the MS-SQL database. The data warehouse allowed for easy access to all of the data needed for reporting and analysis. Additionally, a set of dashboards were created to provide visual representations of key performance indicators (KPIs). These dashboards allowed users to quickly identify trends and make decisions based on real-time data. Finally, Brainvire's BI Reporting Solution provided an automated system for generating reports on demand. This allowed users to quickly generate reports with up-to-date information without having to manually enter queries or manipulate data. The automated system also enabled users to customize their reports according to their needs.
The Challenges
- Integrating A Faculty Performance Analysis:We had to deal with humongous data of students and faculty, it was time consume to work with such large data.
- Custom-Dashboard:Creating custom dashboard according to the business requirement of the client
- Accessing Data from Different Sources:As different type of data was fetched from all the different sources and was completely unstructured.
- Restructuring:Database Migration and integration of third-party tools.
Tech Stack
Angular
Microsoft SQL Server
Python
.Net core
Azure cloud
Power BI
Result
Extract meaningful insights
Helped to make sense of the data and extract meaningful insights. It also helped the client understand better understand relationships between different Faculty Performance.Interactive Dashboards
The dashboard was designed to provide the client with an easy-to-understand graphical representation of the data.Easier analysis and reporting
It become easy to compare data from different sources and identify insights, allowing users to focus on more important tasks like analyzing data or creating reports.Forecasting Passing Rates
Our solution provides clean data visualization that aids in the identification of high-performing and low-performing students and faculty.
