About
The client is a serial entrepreneur who has a vision of empowering all businesses with cutting-edge Business Intelligence (BI) tools. He partnered with Brainvire to transform his vision into reality by developing a SaaS solution for different industries like automotive, retail, healthcare, and many others.
Project Highlights
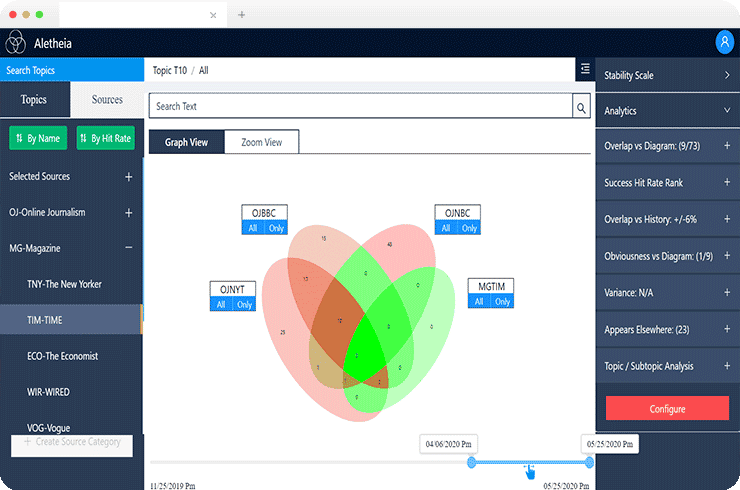
The web platform is a powerful reporting tool and can be used by businesses belonging to any industry. It has been developed by the skilled expertise of Brainvire’s data scientists and in-house experts. The tool can generate resizable, colorful and animated circular and oval Venn diagrams. The represented data tends to be immutable, large in volume, ordered by time and is primarily aggregated for access. It represents a history of what happened, and using predictive analytics, the system can predict what may happen in the future or establish operational thresholds for the system. This helps the end-users make profitable decisions quickly. They can also zoom in from graph mode to data segment and pay careful attention to all the details. Additionally, ElasticSearch ensures that search results are delivered to users at a lightning-fast speed. Last but not least, all changes in the database are reflected in the user interface in real-time.
The Challenges
- Generate Venn diagram up to 5-wayGenerate diagrams with 32 possible intersecting regions and dynamically resize them and their color.
- Real-time Variation of Graphical DataThe graphs should vary in size and color depending on the density of data.
- Handling Massive Volumes of DataA systematic approach was required for handling huge data on the graph.
- Real-time Reflection of ChangesUpdate all the changes taking place in the database to the UI in real-time.
Tech Stack
MongoDB
NodeJS
Socket.IO
elasticsearch
3Djs
ReactJs
Result
Stunning Graphical Representation of Data
Decision-makers can view the data they want in an easy-to-understand graphical format with multiple colors.Limitless Flexibility and Scalability
The SaaS-based business model makes the platform extremely flexible and scalable according to business needs. Organizations from small startups to large multinational players will get the same benefit from this business intelligence software.Automatic Data Segmentation
All data is automatically segmented (categorized) in the form of topic, sub-topic, or as per the client’s requirements.Better Forecasting
By analyzing different types of metrics, the executive leadership can be well-prepared to meet the future market demand of their niche.
